Present Your Data with Thorntale AI
We’ve married two of Thorntale’s coolest features: Thorntale AI and Thorntale Charts! Thorntale Charts-AI is now official.
With the power of Thorntale AI, making a chart has never been easier. You simply describe what kind of chart you want, and paste your data directly in the Thorntale AI chat.
Thorntale AI can also modify existing charts in your presentation. Try asking it to…
- Split this chart by category
- Turn this bar chart into a line chart
- Group my data by week
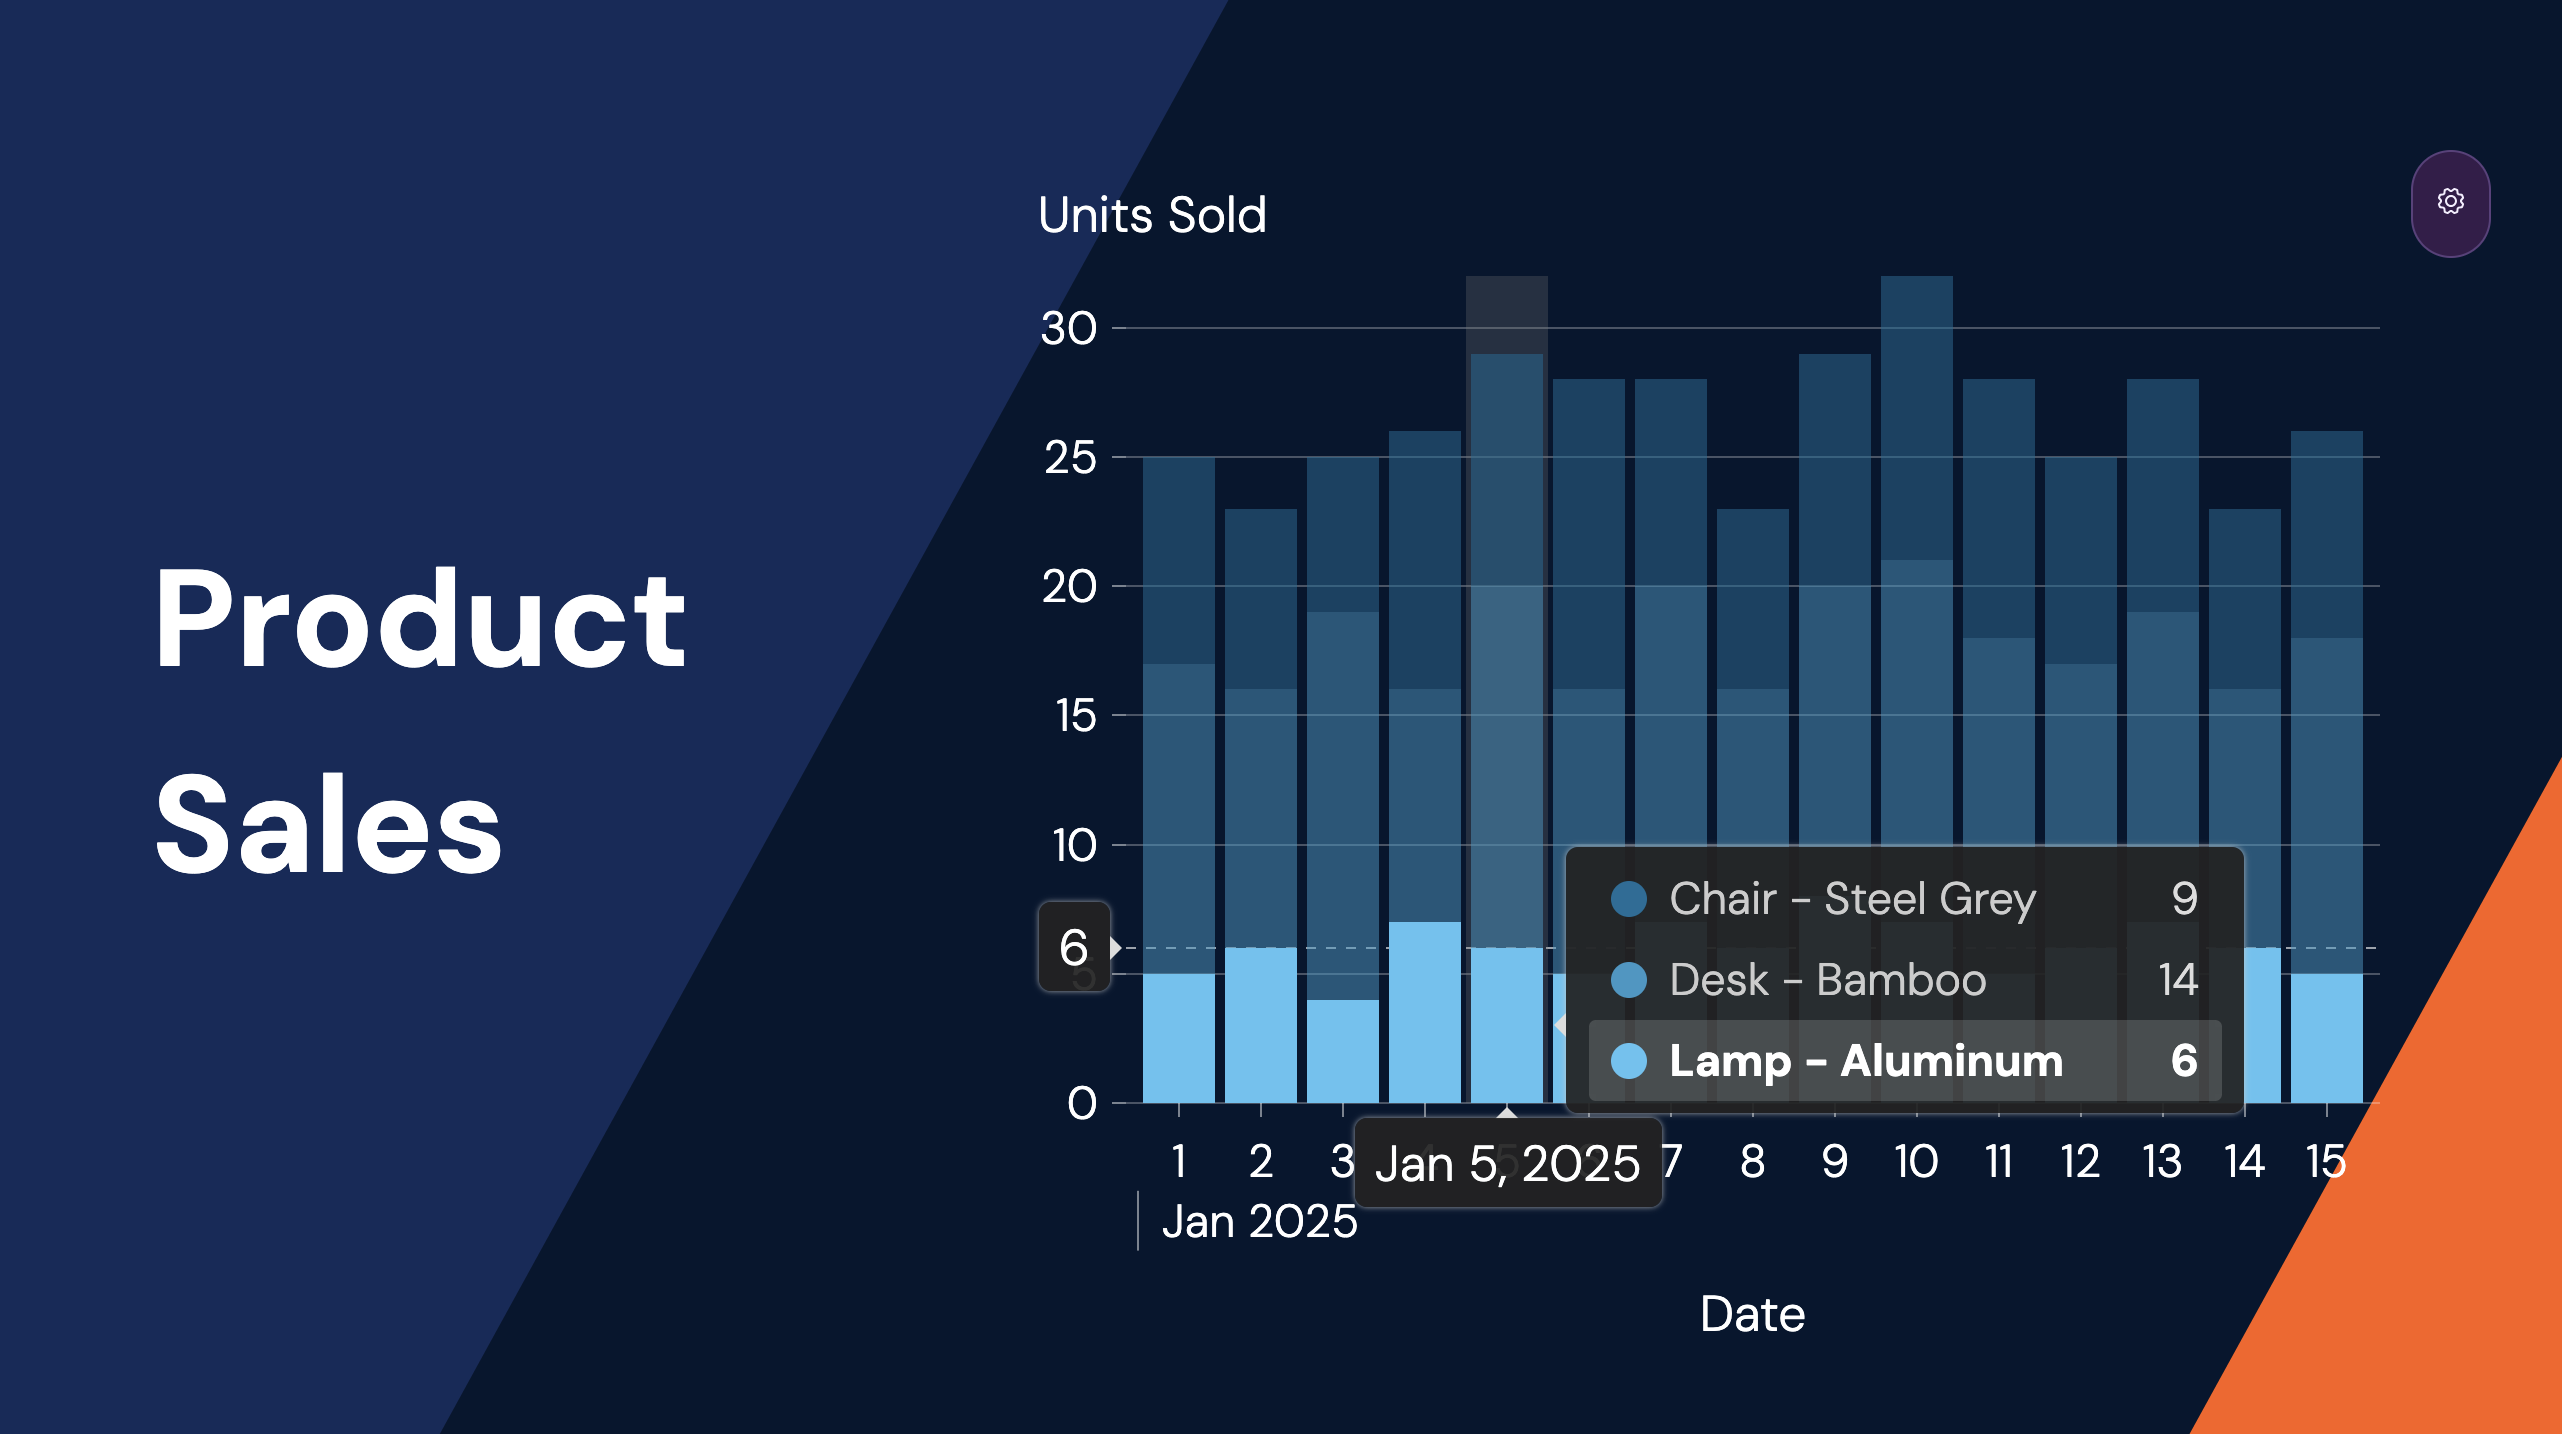
Thorntale Charts continue to support live interactivity, to point out data and keep your audience engaged.
Are you ready to incorporate data into your next presentation?

John Stimac
John builds Thorntale’s frontend and data visualizations.