Present your best
Thorntale is the easiest way to create beautiful presentations.
Automatic slide layouts, AI creation, and beautiful themes, all designed to make you stand out.


Don’t you have better things to do?
Thorntale AI handles the busywork so you can focus on what matters.
Missing an agenda? Need to split up a cluttered slide? Want someone to give the whole deck a grammar check? We’re on it.
Can you split this slide into one slide for each main point?
A head start is half the battle.
There is nothing we dread more than a blank page.
We’ve been in your shoes before. It’s time to ditch them for some new kicks; step into our curated template library and make anything your own.

Be half-hearted
Be thrown together
Be lackluster
Be Memorable.
Tell your story, without fighting with your slides. Thorntale handles the details so that you can focus on the content.
With Thorntale’s design library, your deck will always look pixel-perfect. (Even if that teammate gets their hands on it.)

AI that works for you, not against you.
Don't get lost in the options
Where was that setting again? Open this panel, expand that icon...
Thorntale AI knows about every single option, setting, and configuration so you don’t have to.

Make Your Presentations Stand Out.
Your audience can tell when you’re nervous. Give yourself zero reasons to be.
Effortlessly align presentations with your brand.
Our customizable themes ensure that every heading, bullet point, chart, and slide fits your aesthetic.

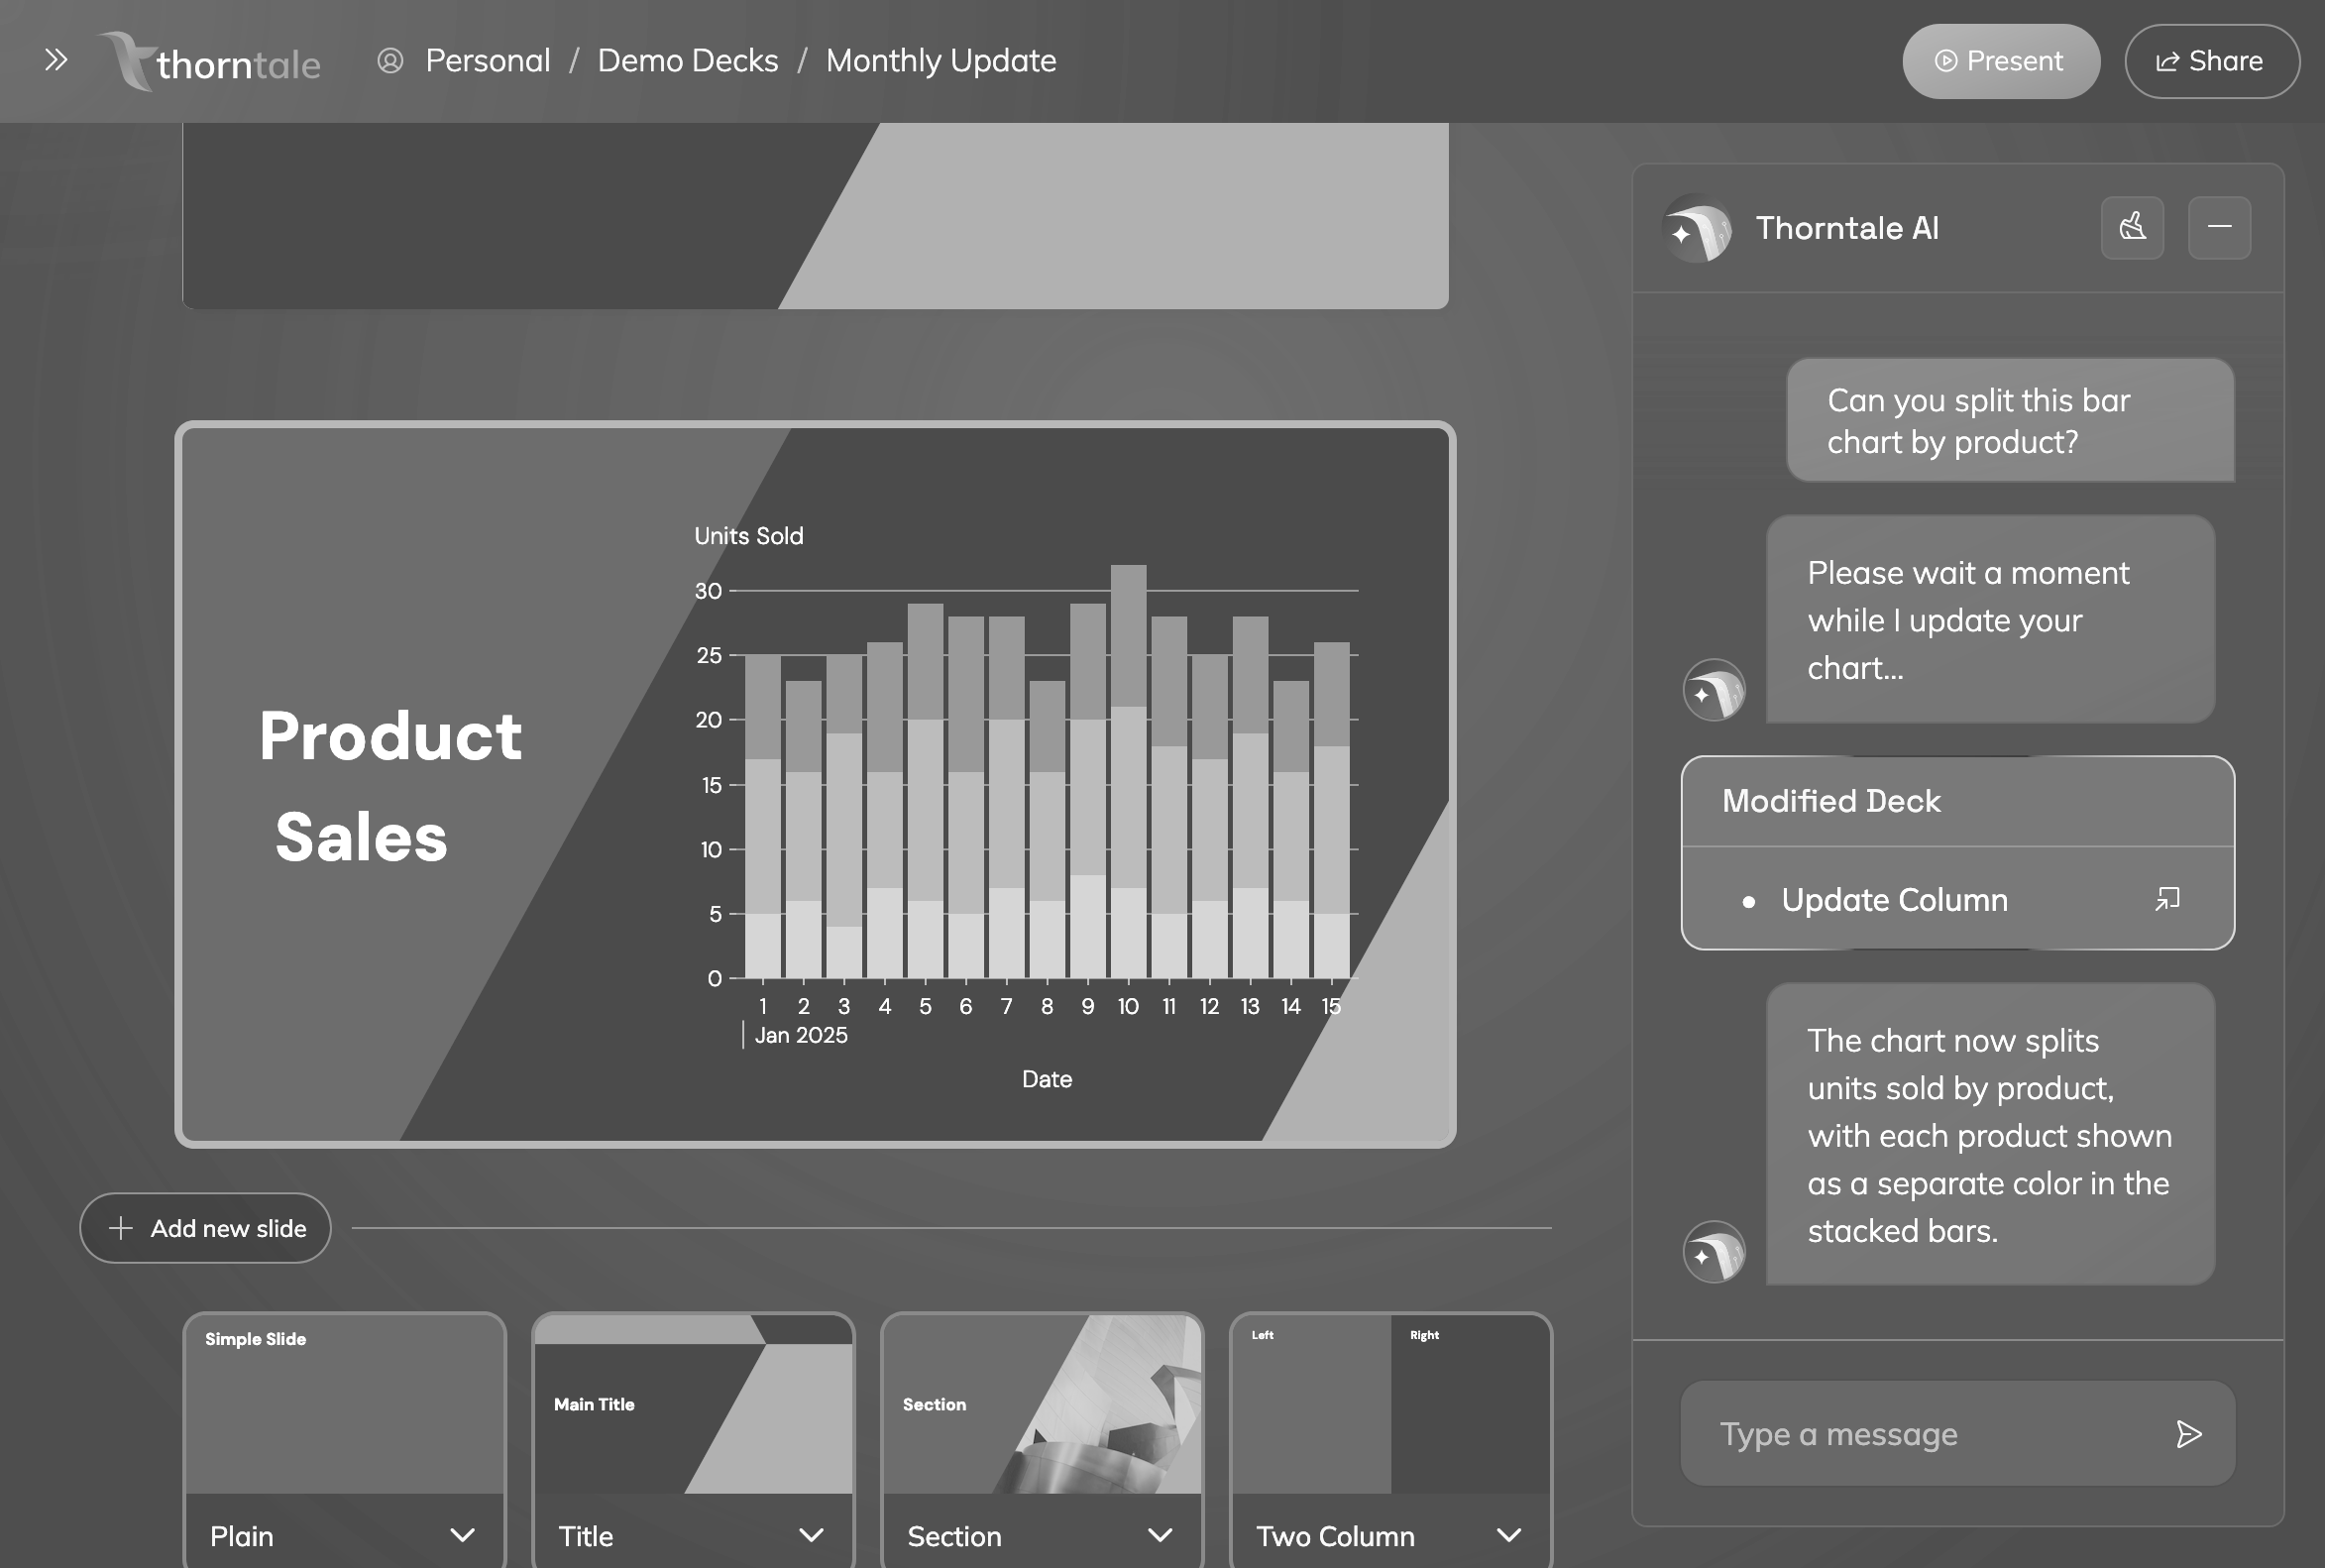
Your data: clean, consise, and captivating.
Create, customize, and present dynamic charts directly in your slides – no SQL or technical skills needed.

Could this meeting be an email?
All Thorntale decks can be sent as beautiful, modern emails. Not attached pdf-exports that no one opens. A real, beautiful email, directly in your audience's inbox.